

Why Leveraged Funds Matter Most
The CFTC publishes positioning data for several groups, but leveraged funds are the ones you need to watch.
Why it matters
- See how major speculative traders are positioned. Understand where large market participants are building long or short positions.
- Identify crowded trades. Heavy positioning can indicate that a market move is becoming increasingly stretched in one direction.
- Assess potential reversal risk. Combine positioning data with price action and other market signals to identify when a trend may be losing momentum.
WHY LEVERAGED FUNDS
The Most Active Group in Futures
Leveraged funds — hedge funds and speculative money managers — are the most actively traded group in the CFTC data. Unlike commercials who hedge business exposure or asset managers who hold long-term positions, leveraged funds trade aggressively to profit from price moves.
Their positioning changes tend to lead price action. When leveraged funds start building or unwinding positions, markets follow. That makes them the single most important group to track in the Commitments of Traders report.

Lead Indicator: Leveraged fund positioning shifts often precede major price moves, giving you an early signal before the move plays out on the charts.
PERCENTILE BANDS
Spot Positioning Extremes
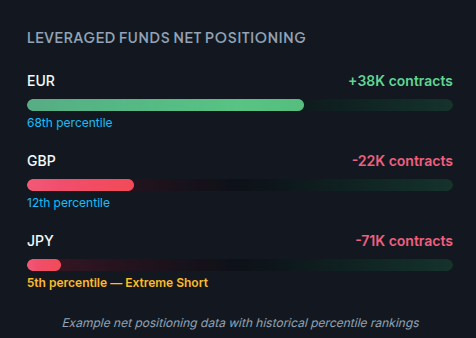
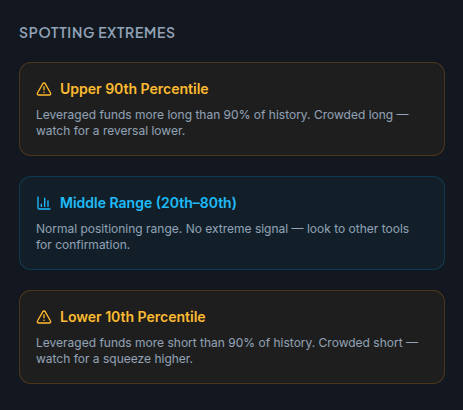
The real power of the CFTC Report is the percentile ranking. It compares current leveraged fund positioning against the full historical range, so you can instantly see whether positions are at an extreme.
When positioning drops below the 10th percentile or rises above the 90th, you’re looking at a crowded trade. History shows these extremes rarely last — and when they unwind, the resulting move can be violent. These are the setups professional traders wait for.
Weekly Updates: New data published every Friday covering EUR, GBP, JPY, AUD, NZD, CAD, CHF and major cross rates like EUR/GBP and EUR/JPY.
What’s Included
Leveraged Funds Net Positioning
Extreme Positioning Alerts
Cross Rate Coverage (EUR/GBP, EUR/JPY)
Historical Percentile Rankings
All Major Currency Futures
Weekly Change Tracking