


Watch the Walkthrough
CESI in action
See how to read the surprise index across major economies, use the differential to rank every currency cross, and pinpoint the highest-conviction trades the market is already repricing.
Why it matters
- See who is beating or missing expectations. Track whether incoming economic data is consistently stronger or weaker than forecasts.
- Identify changing economic momentum. Spot economies where the flow of economic data is improving or deteriorating relative to expectations.
- Build stronger relative FX views. Compare economic momentum between countries to help identify potential currency opportunities and differences between economies.
Why Surprise Beats Strength
An economy can be weak and still rally its currency. A strong print can crash one. The CESI captures the only thing that actually matters at the moment of release — whether traders and economists were caught off guard.

Beats vs Forecast
When data prints above the consensus forecast, the index rises. The market then has to reprice upward expectations — and that repricing is what drives the currency.

Rolling Surprise Score
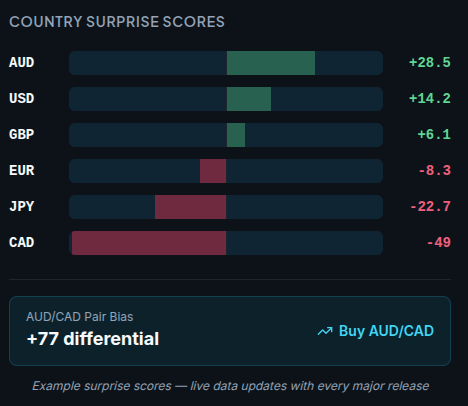
Each economy carries a single rolling score. Aussie at +28.5 means Australian data is consistently beating; Canada at –49 means CAD is consistently missing — regardless of absolute strength.

Narrative Shift Detection
The chart shows whether the surprise trend is accelerating, stalling or reversing — so you know whether the existing market narrative still has fuel or is about to flip.
From Country Score to Currency Cross
The real edge isn’t the headline number — it’s the differential between two economies. Pair the strongest beat with the weakest miss and the bias is mathematical, not opinion.
PAIR DIFFERENTIAL
A Buy AUD/CAD bias, written in the data
If Aussie data is sitting at +28.5 and Canadian data at –49, the AUD/CAD pair analysis loads with a differential of +77. That’s a clear long bias — not enough on its own to enter, but exactly the kind of underlying lean institutional desks use to size up.
Combine the differential with structure on the chart — trend, key levels, volatility bands — and you’re stacking edges instead of guessing.

Every Major & Minor Cross: Pair analysis is pre-built for the full grid — instantly see which crosses have the strongest mathematical bias right now.
The Optimal Trade Grid
Beyond the country scores, the tool surfaces the trades that are ready to go right now — the cleanest pairings with the strongest divergence in surprise data.
Highest-Conviction Pairings
See the major and minor crosses with the largest surprise differential — the trades where the underlying lean is mathematically strongest right now.

Avoid the Crowded Wrong Side
Stop fading data prints just because they “feel” extreme. Let the differential confirm whether you’re trading with the repricing flow or against it.

Pair With Chart Structure
Use the bias as your top-down filter — then layer on trend, key levels and volatility from the rest of the suite to time the entry.
What’s Included
Live Surprise Score for Every Major Economy
Pre-Built Pair Analysis (Majors & Minors)
Optimal Trade Grid — Highest Conviction Pairs
Rolling Trend Chart per Country
Differential Score for Every Cross
Updates With Every Major Data Release