

Implied Volatility Tracker
Find exact entry and exit levels derived from options market data.
Get high-probability turning points with statistical backing using standard deviation bands that define where price is likely to stay.

Watch the Walkthrough
Understanding implied volatility
How options pricing reveals market expectations — and how to turn standard deviations into actionable entries, targets and stops on every major pair.
Why it matters
- Understand expected market movement. Monitor implied volatility and options pricing to see whether traders are anticipating a larger move or a quieter market.
- Set more appropriate stops and targets. Use expected volatility to avoid stops that are too tight or targets that are unrealistic for current market conditions.
- Identify changing event risk. Spot increases in expected volatility around major economic releases and other events that could create significant market moves.
Intermarket Analysis — Seeing the Bigger Picture
Most traders make the mistake of staring at a single chart and trying to make trading decisions in isolation. But the reality is that every market is connected to others in ways that directly influence price movement.
This is where intermarket analysis comes in — a powerful approach that lets you see the full story behind the price action.
If you want to understand where the Australian dollar might be headed, don’t just look at AUD/USD — watch what’s happening with iron ore prices and China’s economy. These are key drivers of Australia’s exports and can often move the currency before the forex chart even shows it.
The same is true for USD/JPY. If you want to anticipate moves here, you need to be watching U.S. Treasury yields. When yields spike, the dollar often strengthens against the yen, and when they fall, the opposite can happen.
And if you want to find turning points in the Forex or Commodities Market — you need to ask the Options Market.

Iron Ore Prices → AUD (Australian Dollar)
Key driver of Australia’s exports
US Treasury Yields → USD/JPY
Yields spike = dollar strengthens vs yen
Oil Prices → CAD (Canadian Dollar)
Canada’s commodity-linked currency
Copper Prices → Risk Sentiment
Leading indicator of global growth
Options Market → Forex & Commodities Turning Points
Statistical turning point signals
The Bell Curve Foundation
Implied volatility isn’t just a number — it’s a probability framework. And probability frameworks are best understood through the bell curve.
Picture a normal distribution. The centre of the curve is the market’s baseline expectation — where price is statistically most likely to sit. From there, we measure outcomes in standard deviations.
- 68% of price action is contained inside 1 standard deviation
- 95% of price action is contained inside 2 standard deviations
If that sounds familiar, it should — it’s the same statistical principle behind Bollinger Bands. The difference is the source: instead of being calculated from past price action, our bands are derived directly from live options market pricing — the most sophisticated forward-looking risk gauge in finance.
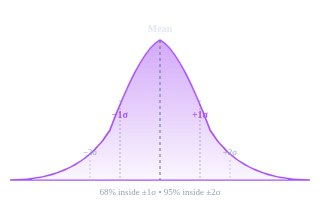
The further price travels from the mean, the lower the probability of getting there — and the higher the probability of a snap-back.
The 1, 2, 3 Standard Deviation Ladder
For every currency cross, the tool publishes three high levels above and three low levels below the day’s expected value. The escalation tells you everything.
±1σ
68%
Normal range
Expected daily working zone. Trades inside here are with the trend, not against it.
±2σ
95%
Stretched
Price is genuinely extended. Reversal probability climbing — fade setups become viable with confluence.
±3σ
99%+
Extreme
Statistically very rare. The further price gets here, the higher the chance of a sharp snap-back to the mean.
Four Ways to Use the Levels
Standard deviation bands aren’t just for entries. Used properly they shape every part of the trade — including the times you choose not to trade.

Entry Triggers
Price tags a 2σ or 3σ extreme against trend or fundamentals → high-probability fade setup.

Take-Profit Targets
Lock in gains as price approaches the next standard deviation level — exits with statistical backing.

Stop-Loss Placement
Park stops just beyond the next σ band. Statistically tight, structurally sound — far better than a flat-pip rule.

No-Trade Zones
When the bands collapse and price is hugging the mean, the market is telling you volatility has died. Sit out — preserve capital for better days.
Stacking Confluence — A NZD/USD Setup
An IV level on its own is a hint. Combined with the broader market context — trend, volume profile, value-area shifts — it becomes a high-conviction trade.
Price taps the −2σ implied volatility support on Kiwi. On its own, that’s a probability edge. But the trade only earns conviction when the wider context agrees.

IV −2σ support tagged
Statistical reversal zone — 95% of action sits inside this band.
Broader trend supportive
Higher-timeframe structure already pointing up. We’re trading with the flow, not against it.
Volume profile P-shape at lows
Excess into the low, value area shifting higher — buyers responding.
Single print acceptance
Aggressive auction footprint confirms participation, not absorption.
Result: Four confluences, one direction. The IV level isn’t the trade — it’s the trigger that fires once the rest of the picture lines up.
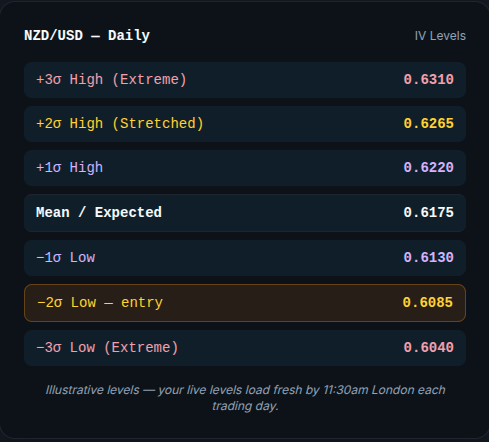
Daily Process in 60 Seconds
Simple, fast, and powered by the options market’s own forecast.
1.Open the date picker
Scroll back and view the previous 5 days of data if needed.
2. Select your instrument
Choose from forex pairs, commodities, or any instrument you’re trading.
3. See IV turning points
Fresh data loaded daily by 11:30am London time — completely updated levels.
4. Plan your entries & exits
Use these high-probability zones to time your market positioning.
How the Market Prices Risk, Uncertainty & Probability
Options reveal what the world’s most sophisticated traders expect next. Translated into bell-curve standard deviations, you get a clearer framework for entries, exits, stops and risk — across forex, commodities, and indices.