
Institutional Context at a Glance
Get an immediate read on whether the market is greedy or fearful, how leveraged funds are positioned, and what history says about the current month.
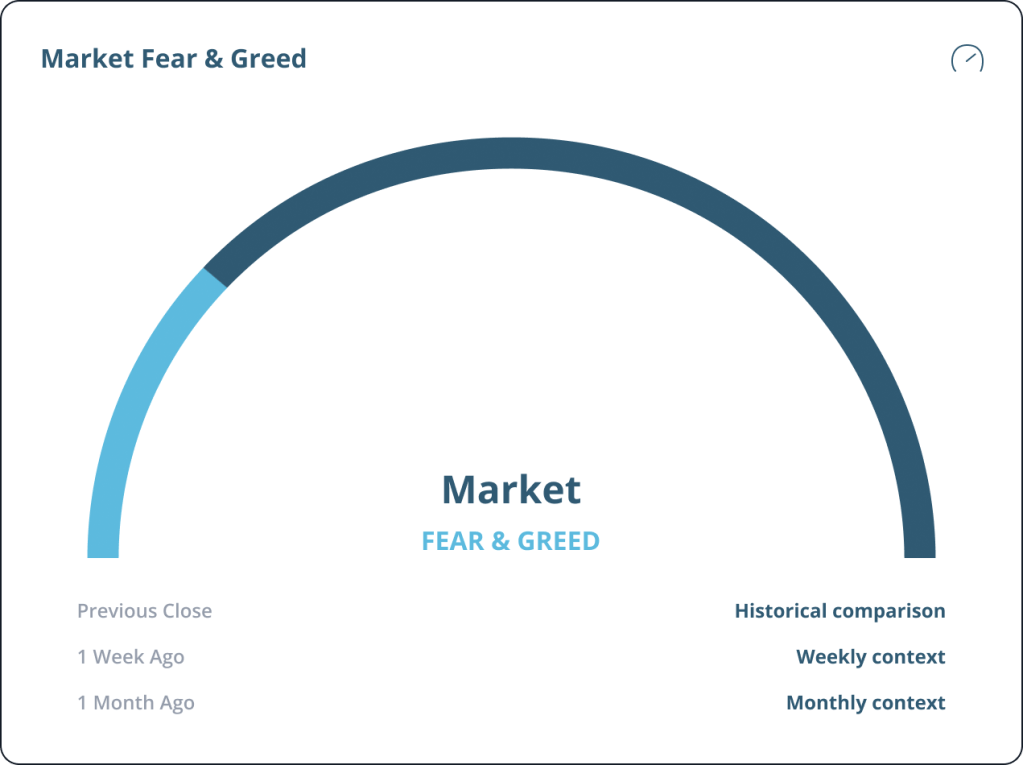
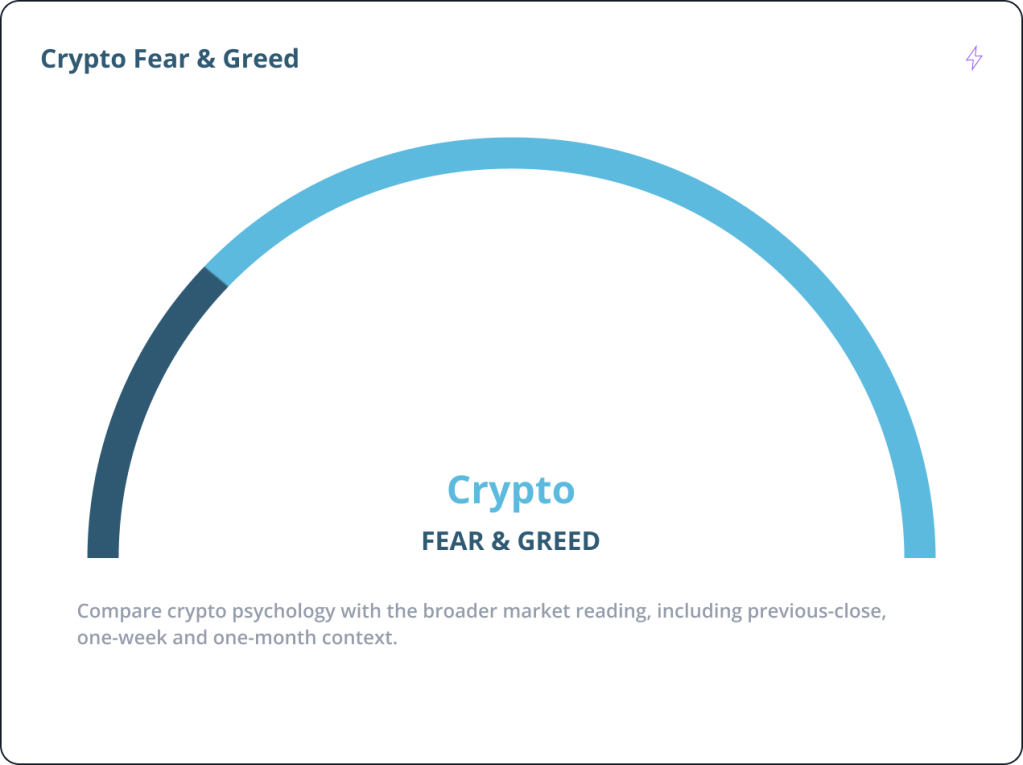

Fear & Greed Index
Market psychology at a glance
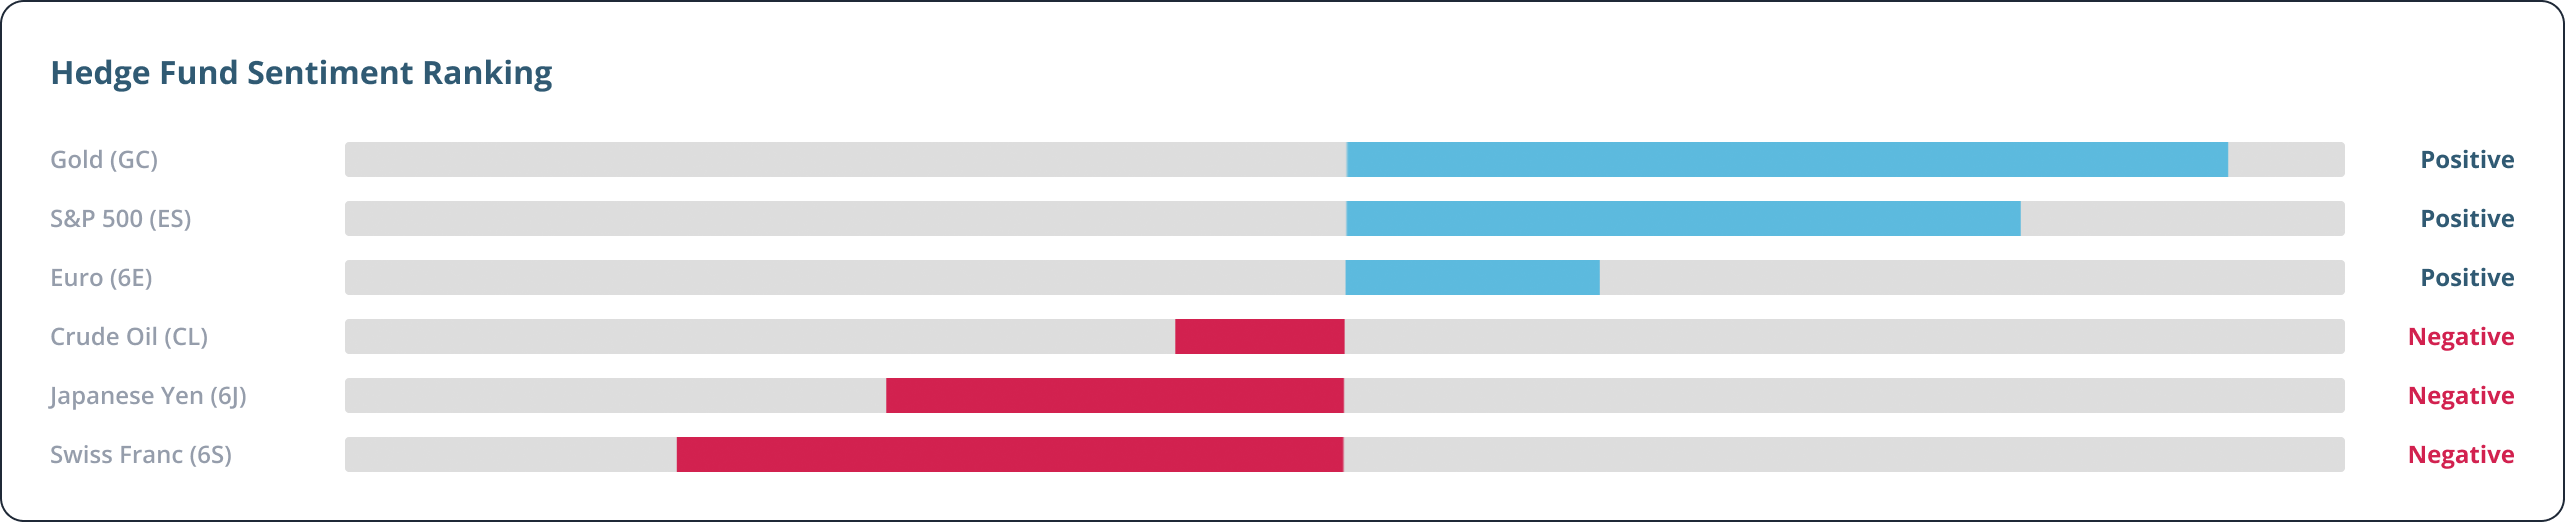
Hedge Fund Positioning
Compare sentiment across assets
Seasonality Matrix
Historical monthly performance
Asset Cross-View
Equities, FX, bonds, metals
From Market Mood to Detailed Positioning
Start with broad psychology, then inspect the forces beneath it without reducing sentiment to one headline score.
Seven market indicators, one readable view
Market momentum, stock-price strength, stock-price breadth, put/call options, VIX volatility, safe-haven demand and junk-bond demand explain what is driving the Fear & Greed score.
Market momentum
Price strength
Price breadth
Put/call options
VIX volatility
Safe-haven demand
Junk-bond demand
Compare positioning across markets
Use the ranking view to see where hedge-fund sentiment is strongest, weakest, or changing across equities, currencies, bonds, metals, and energy.
Cross-asset ranking
Positive / negative bias
Relative positioning
Historical context
Category filters
Safe-haven demand
Put Sentiment and Seasonality in Context
Compare current market mood and positioning with recurring historical patterns, then decide which areas deserve a closer look.
SMART MONEY TRACKING
Follow Hedge Fund Positioning
Rank major futures markets by hedge-fund sentiment to see where positioning is most positive, most negative, or changing over time.
Compare assets on a consistent scale and move between indices, currencies, bonds, metals, energy, and agricultural markets without rebuilding the view.

Broad Coverage: We track positioning across Indices, Currencies, Bonds, Metals, Energies, Grains, Softs and Meats.
POSITIONING VIEWS
Cross-Asset Ranking
Sort the covered markets to see where hedge-fund sentiment is strongest and weakest at a glance.
Historical Comparison
Place the current reading alongside recent positioning history to understand whether sentiment is shifting or holding steady.
WHAT YOU CAN EXPLORE
Compare Lookback Windows
Switch between 3,5,7, and 10-year histories to see whether a seasonal pattern persists across different samples.
Check Monthly Consistency
Review average returns alongside the number of positive and negative years for each calendar month.
Review Dispersion
Use year-by-year heatmaps and standard deviation to see whether an average is consistent or driven by an outlier.
HISTORICAL SEASONALITY
Explore Seasonal Patterns
Markets exhibit recurring seasonal patterns due to corporate cash flows, harvest cycles, tax seasons, and institutional portfolio rebalancing.
Our Seasonality Matrix calculates the monthly performance averages for every asset over 3, 5, 7, and 10-year lookbacks. A year-by-year heatmap immediately shows you if a month’s average is skewed by one outlier year or if it’s a consistent, reliable trend.
Granular Data: See exactly how many times a month was positive or negative over a decade, and track the standard deviation of those returns.
What’s Included
Market & Crypto Fear & Greed
3, 5, 7 & 10-Year Lookbacks
Positive/Negative Month Frequency
Hedge Fund Sentiment Ranking
10-Year Seasonality Heatmaps
Cross-Asset Coverage