Weekly Market Insight

March 27th 2018

Mar 27, 2018 Written by Gavin Pannu, MSTA, CFTe

Fundamentals: Strong Impact

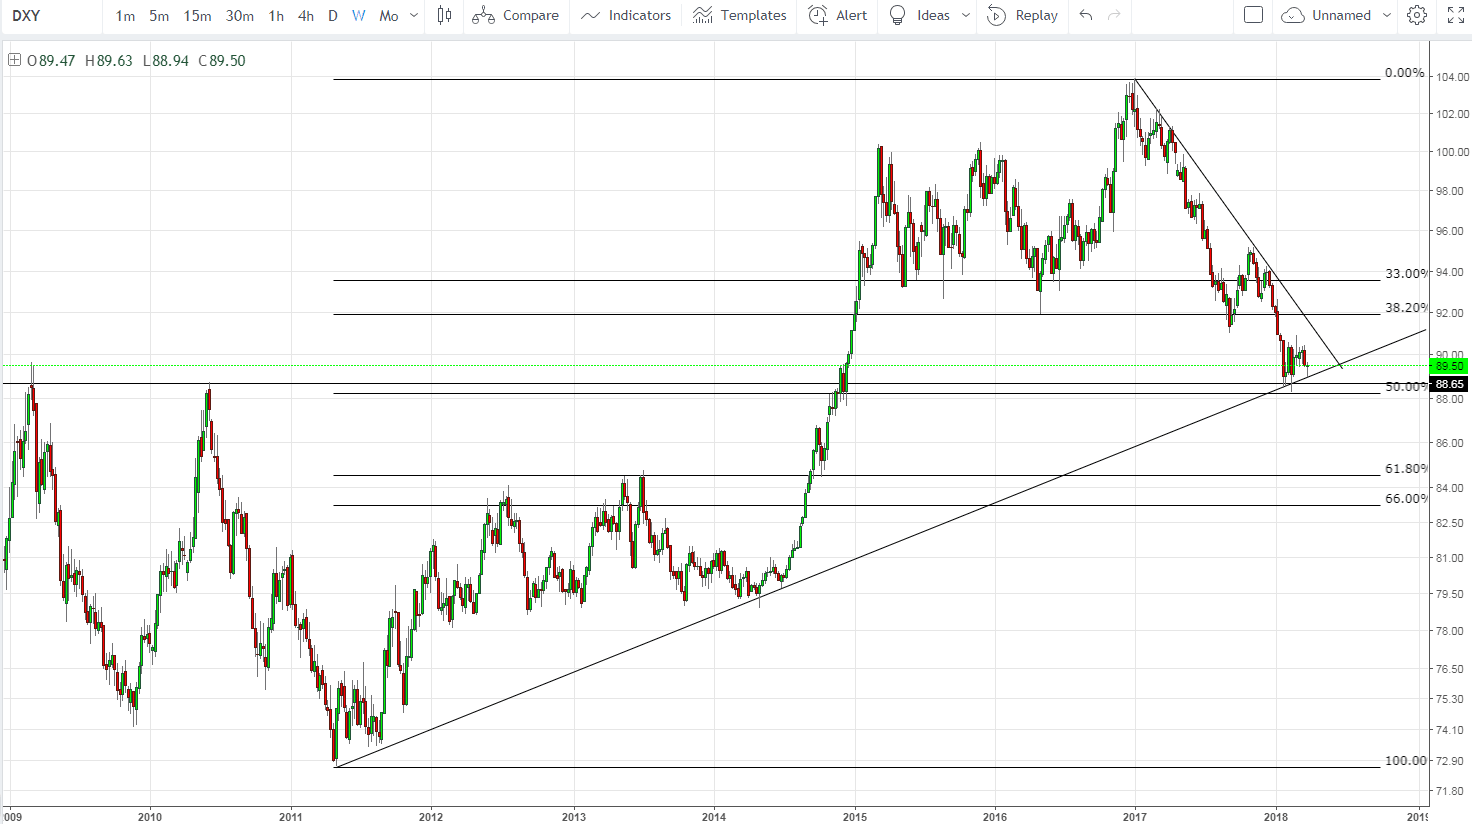
The Fed raised the interest rates to a maximum of 1.75% which was widely expected and will continue increasing rates. Jerome Powell and his colleagues did not raise the projection for hikes in the dot-plot for 2018 which was also expected and were disappointed by the slow rise in wages. Powell mentioned that businesses had voiced concern in regard to recent trade tariffs. If markets continue to falter, the Fed may slow down the pace of hikes and this could hurt the US Dollar.

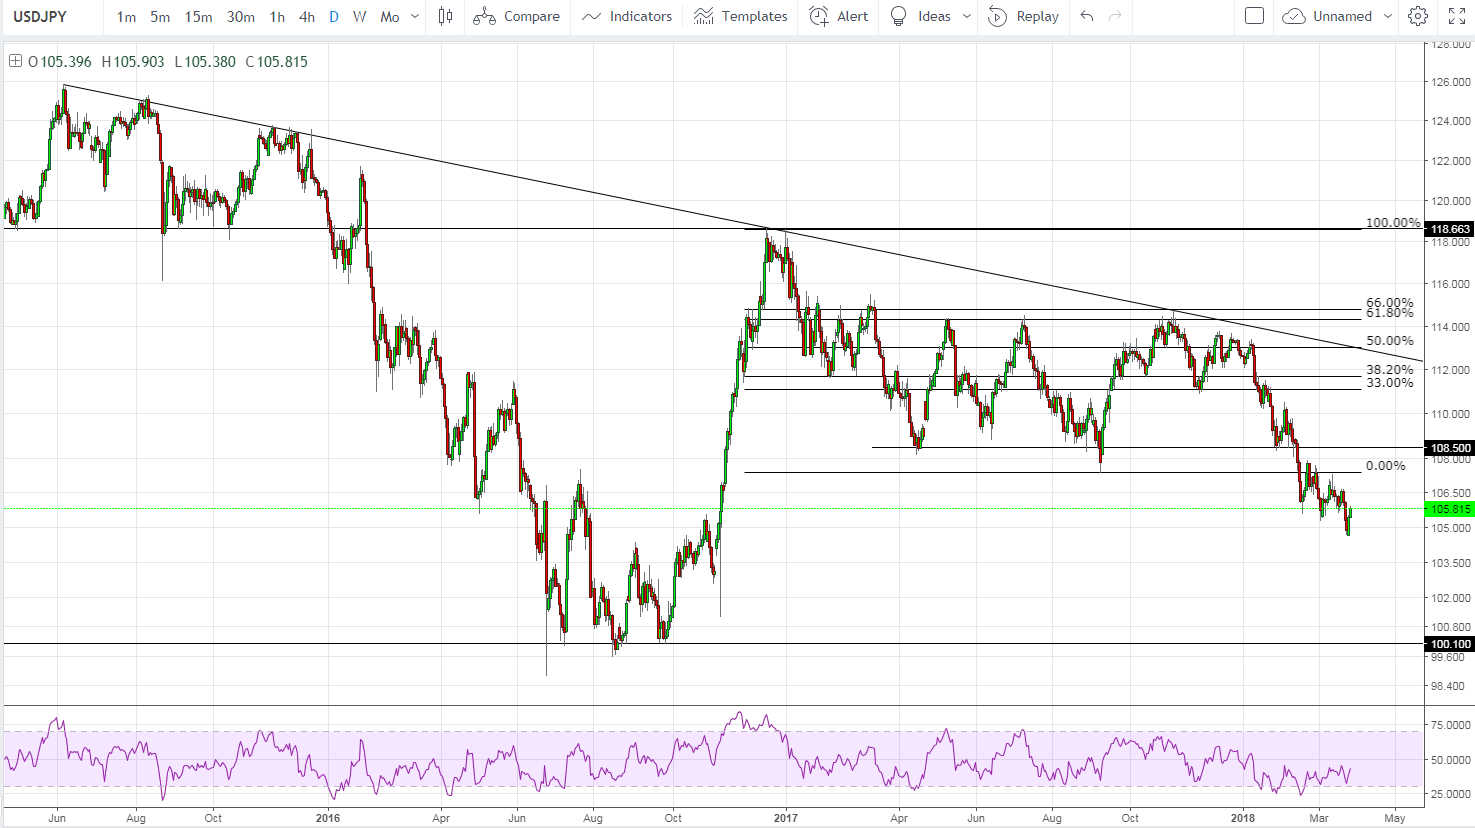
Donald Trump publicised plans to impose tariffs on Chinese goods and also sanction the world’s second-largest economy on Intellectual Property. The estimated size of the underlying products is around $50-60 billion. The Japanese yen is a safe-haven currency that gains in times of trouble and the sharp losses in stock markets lead a move to risk-off assets. In addition, the US approach towards North Korea could add to the safe-haven flows. The trade tariffs set by Donald Trump on steel and aluminium came into effect. Many countries received an exception apart from Japan.

Be aware of interference from the Bank of Japan as strength in the Yen has a direct impact on Japan’s exports.

Weekly Market Insight March 27th 2018

Strong downtrend from the highs of 114 handle and a breakthrough of the recent low of 108. Price action continues to make lower lows and lower highs but the secondary indicator RSI is starting to show a weakness in the momentum with divergence in the oversold.

secondary indicator RSI

Dollar Index holds at the 50% Fibonacci level and rebounding a significant prior resistance level which now becomes support along with the third touch of the trend line.

Dollar Index holds at the 50% Fibonacci level
Price action remains below the 200 and 50 simple moving average. Recently the price had a breakout of a symmetrical triangle pattern and now a potential retest of the 106 handle. A rejection of the down trend line along with the support of increased volume. The secondary indicator MACD remains in the bearish zone below 0 and waiting for a potential crossover.
secondary indicator MACD remains in the bearish zone below 0
With volatility increasing in the markets, the Bollinger band shows the extreme overbought and oversold regions effectively which is testing the upper band. In addition to the secondary indicator Stochastics reaching the overbought zone.