Book a Free Consultation
President Donald Trump’s plans to impose tariffs on Chinese imports initially helped spark market volatility the week of March 19th. Widespread worries over a trade war between the U.S. and China escalated and vented fear in equities.
Move up to last week and comments by top Trump administration officials helped calm markets somewhat. Certainly, the prospect of ongoing trade talks between the two nations was soothing news.
Treasury Secretary Steven Mnuchin and Commerce Secretary Wilbur Ross dialled back some heavy rhetoric from the Oval Office that had pointed toward a trade war.
Indeed, Mnuchin said he’s hopeful a trade deal can be reached between the U.S. and China, and Ross added that the tariffs could be viewed as bargaining chips in trade negotiating talks.
However, one cannot say all is well as privacy practices of tech giants like Facebook (NASDAQ:FB) bubbled to the surface on March 27, causing stocks to tank lower once again.
This was the second period of market volatility in 2018-the first being the sell-off in early February, what is proving interesting is that, in both instances, non-U.S. equity markets outperformed the U.S.
Many see U.S. equities as expensive whereas non-U.S. equities as more attractively priced. Still, this has been a view held since last summer but this year, more than before any disruptive news has been most energetically expressed in U.S. stock prices.
Yields on long-term U.S. Treasury notes have probably come close to their high-water mark for the current market cycle. As of March 30, the yield on the 10-year U.S. Treasury is at 2.73%; one can expect it to peak around 2.8% in a year’s time. So, the break above 3.0% has been stayed for the time being at least.
With the 10-year moving lower, the yield curve T2/T10 has begun flattening and is still threatening to invert. Inverted yield curves are not a good sign for markets as the yield curve is typically inverted before most recessions.
Whether or not the yield curve inverts later this year will be a big watchpoint for investors. If it does invert, it’ll probably be because yields on the 2-year U.S. Treasury note keeping increasing, due to additional Fed rate hikes later in the year.
The U.S. Dollar edged down against a basket of other currencies on Friday in a thinly traded day as major markets in the U.S. and Europe were closed for Easter weekend.
The U.S. Dollar Index, fell 0.01% to 89.75 as at the US close on Thursday.
The Dollar was unmoved by a flurry of economic data on Thursday that showed a strengthening U.S. economy.
The Federal Reserve’s preferred inflation measure, the personal consumption expenditures (PCE) price index excluding food and energy, rose 1.6% in the 12 months through February, in line with economists forecast.
Another report revealed that initial jobless claims dropped by 12,000 to a seasonally adjusted 215,000 for the week ended March 24, so exceeding forecasts for a drop to 230,000.
Meanwhile, the Commerce Department said consumer spending, which accounts for more than two-thirds of U.S. economic activity, met expectations, rising 0.2% last month, meeting economists forecasts.
USDJPY fell to a low losing 0.23% to trade at 106.19.
EURUSD was higher, with the pair up 0.24% to 1.2330, GBPUSD jumped 0.29% to 1.4059.
AUDUSD was higher, with AUD/USD rising 0.33% at 0.7701, while NZDUSD inched up 0.19% to 0.7245.
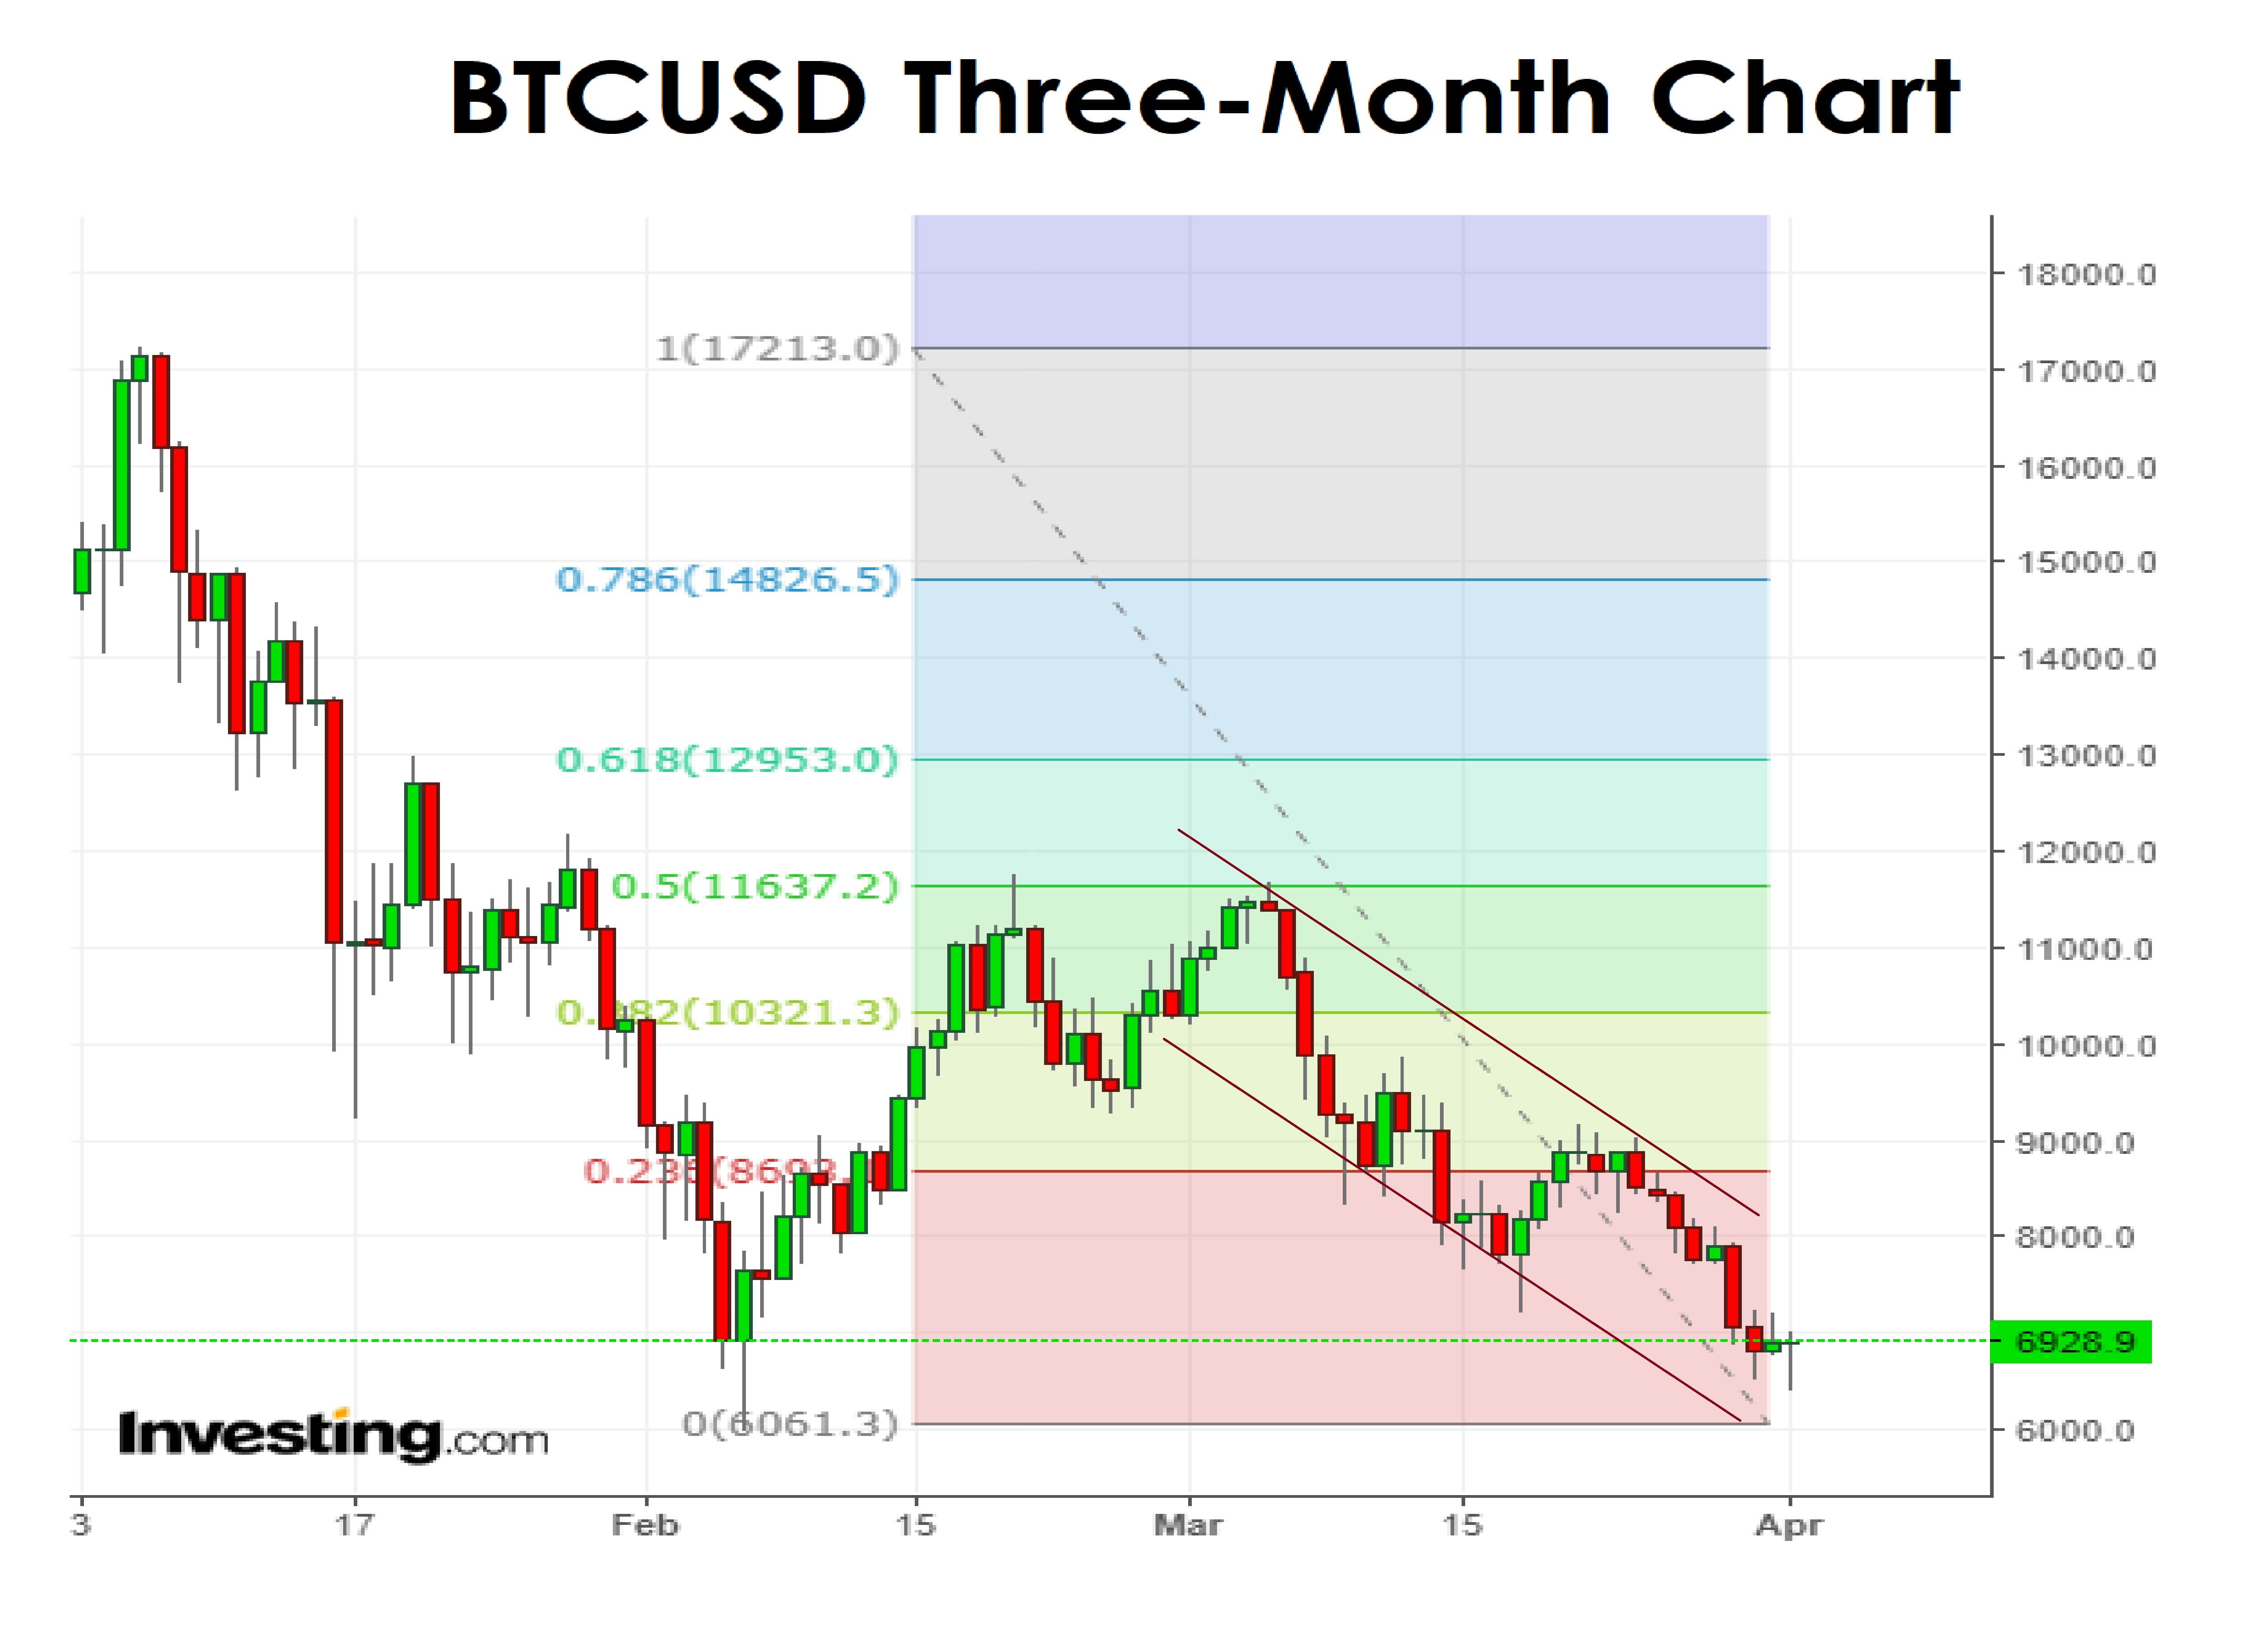
In the cryptocurrency space, Bitcoin on Friday, March 30th, the first day of an extended Easter weekend BTCUSD fell and nearly broke the $6,000 level.
Metals
The price of gold has been driven by the weakness of the Dollar, and the market is anticipating higher interest rates on the long end. If long-term bond yields breaking out to the high side it would cause a lot of issues with the economy, the government, and corporations.
This increase will be bad for the stock market and will likely cause a move from cash into gold. That said, now the risk of T10 going above 3.0% has been mitigated. So, one could argue that for a gold rally to take hold we may need to be patient until June.
The precious metal had rallied at the start of the week, peaking at a five-week high of $1,356.80 on Wednesday before turning sharply lower as safe haven demand was hit by easing trade tensions and hopes for a diplomatic breakthrough with North Korea over its nuclear program.
Traders will be looking ahead to Friday’s U.S. jobs report for indications on the future direction of U.S. monetary policy after the Federal Reserve hiked rates for the first time this year two weeks ago and stuck to its projection for three rate hikes this year.
Indications that the Fed is likely to stick to its plan for gradual interest rates increases have supported gold, which struggles to compete with yield-bearing assets when interest rates rise.
Elsewhere in precious metals trading, silver was up 0.54% to $16.34 a troy ounce and recorded a 1.66% weekly decline.
Platinum settled at $936.60, down 0.45% for the day and was down 2.03% for the week.
Among base metals, copper for May delivery was up 0.7% at $3.023 in late trade for a weekly gain of 1.21%, rebounding from Monday’s three-month lows of $2.938.
Oil
Ongoing efforts by major global oil producers to cut output and reduce a global glut against a steady increase in U.S. production will continue to be the main driver of sentiment in the oil market in the week ahead.
Oil traders will await fresh weekly data on U.S. commercial crude inventories to gauge the strength of demand in the world’s largest oil consumer and how fast output levels will continue to rise.
They will also pay close attention to any comments from global oil producers for further hints on whether they plan to extend their current production-cut agreement into next year.
Oil prices ended higher on Thursday, as traders cheered data showing the first fall in U.S. oil rigs in three weeks.
Grains
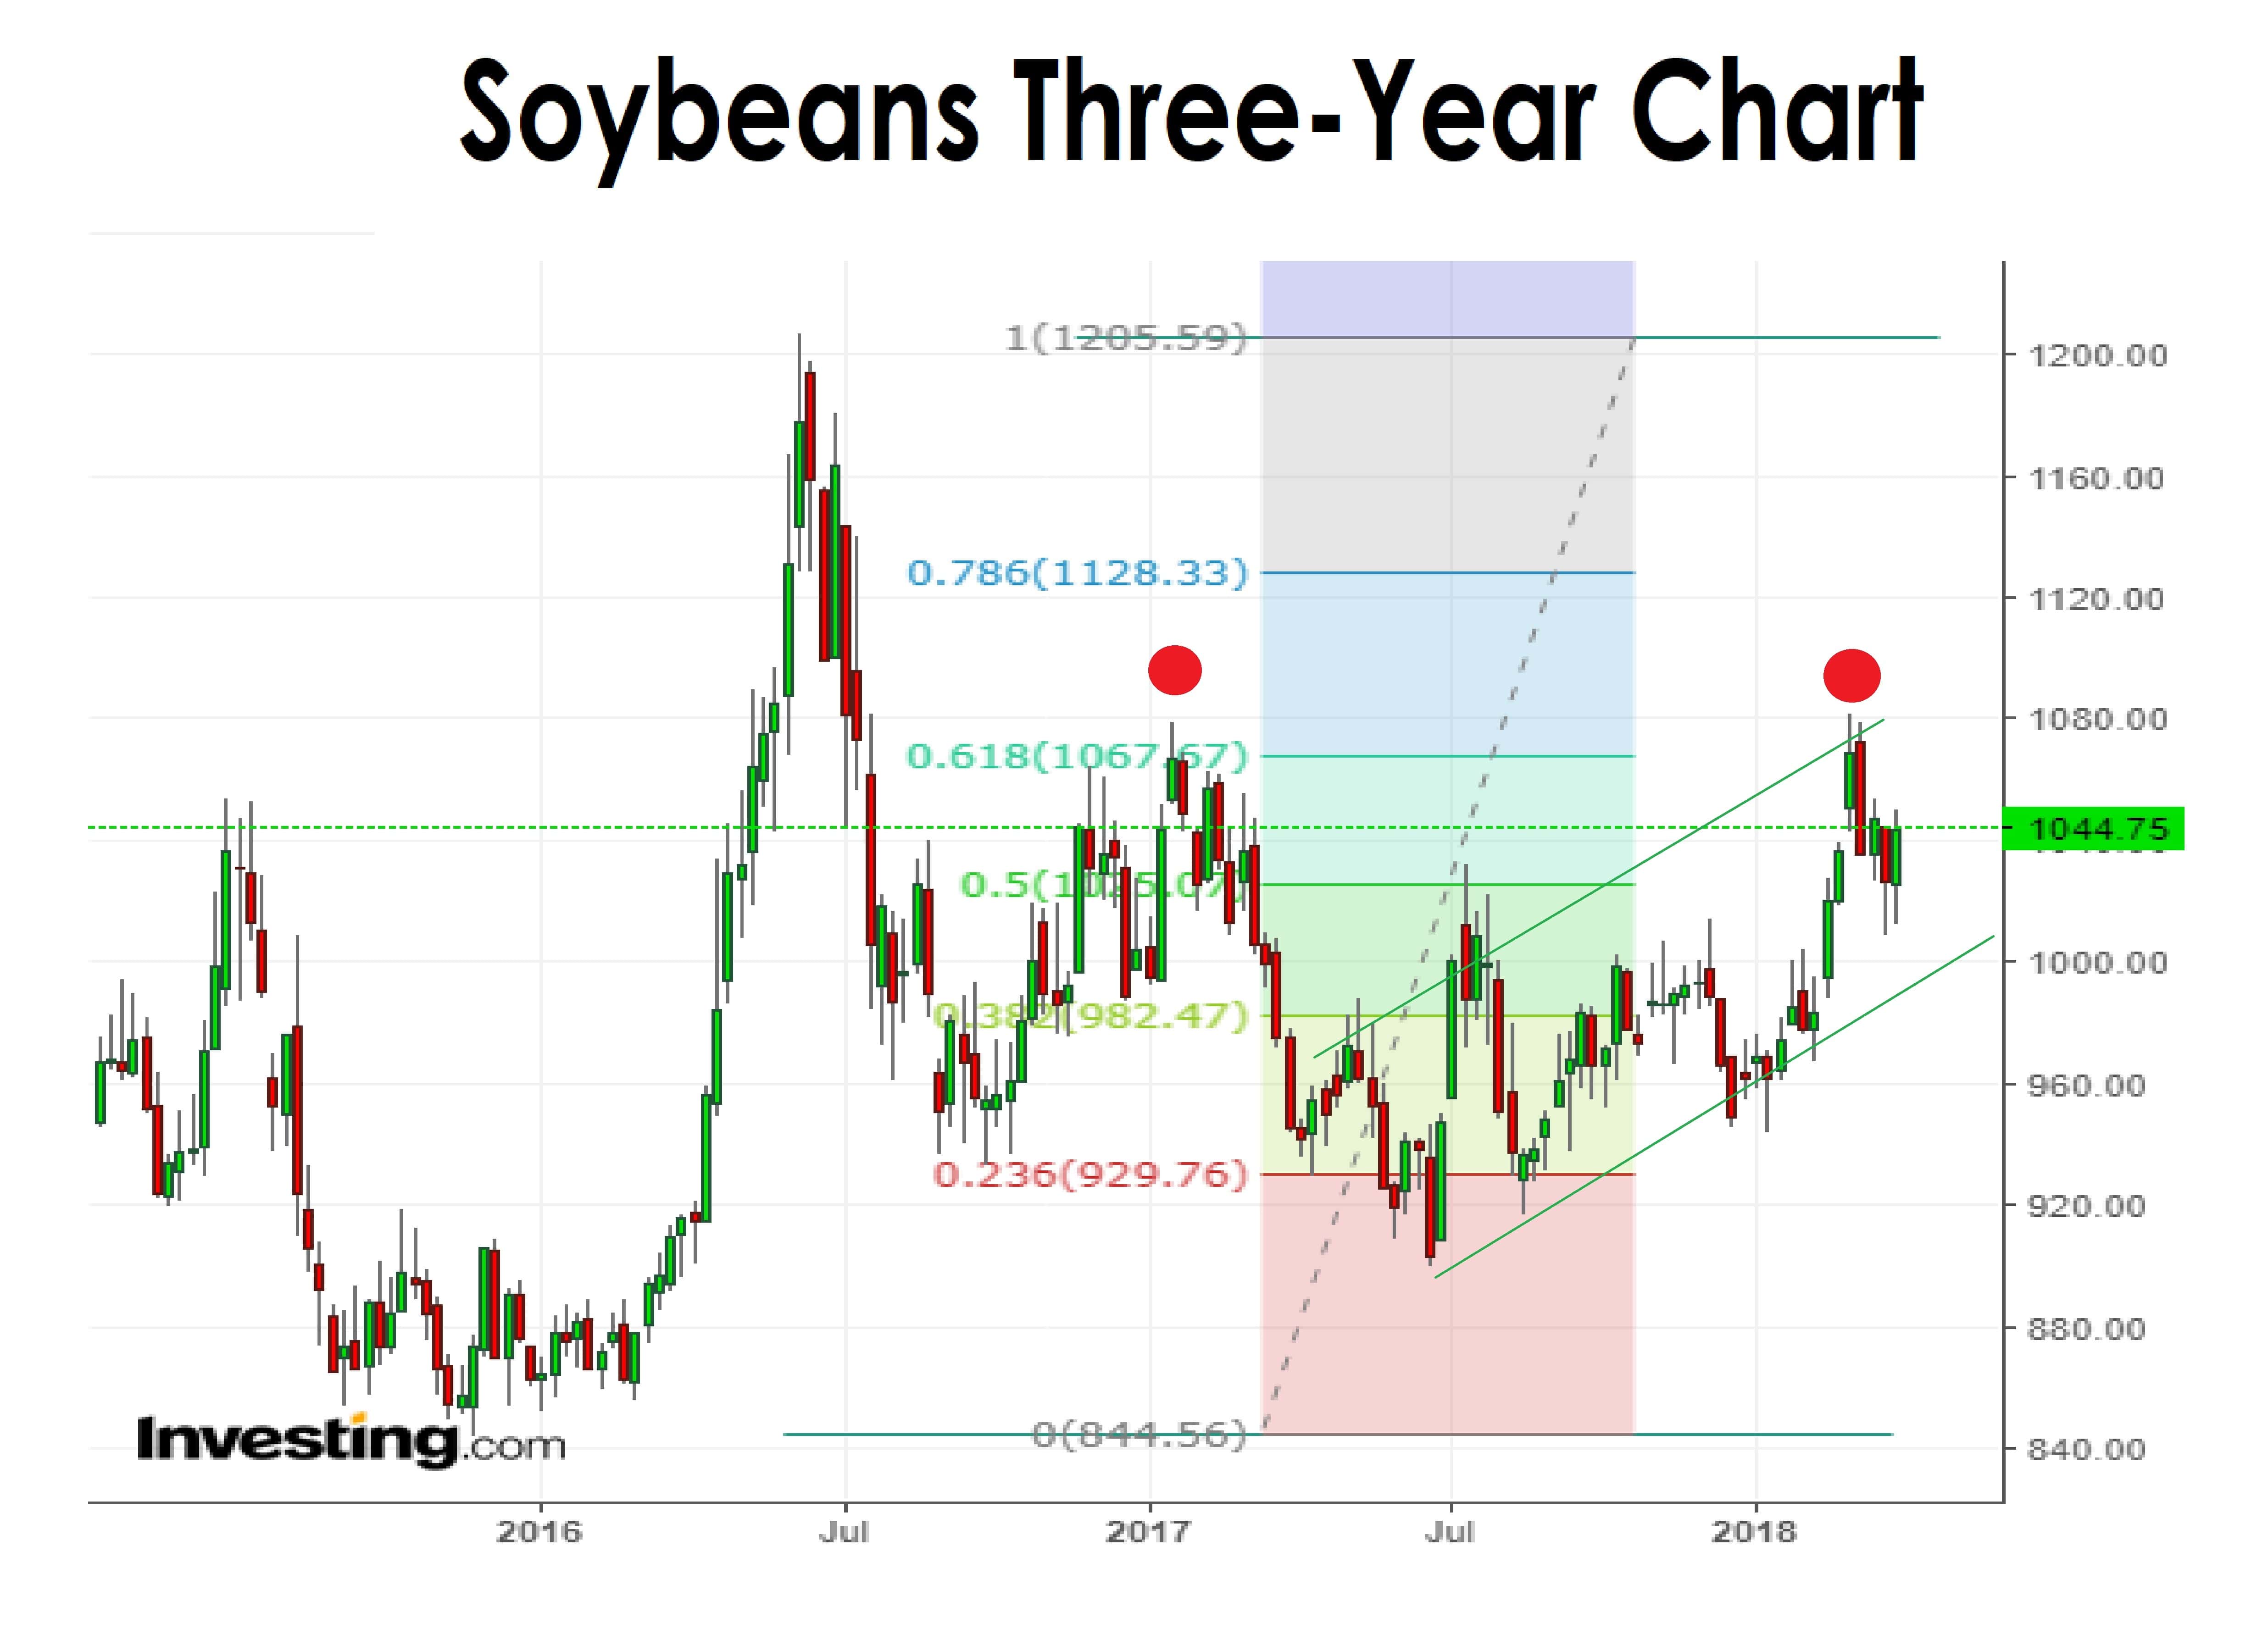
Let’s take a moment to think about Soybeans.
China’s imports of soybeans from the U.S. in January fell 14% from the same month a year ago, customs data showed, as Brazil grabbed a larger slice of the world’s biggest market for the oilseed with higher-protein beans.
According to customs data, China imported 5.82 million tonnes of soybeans from the U.S. in January, equal to 67%. Last year, U.S. beans accounted for 88.5% of the January total.
The drop underlines concerns about a slide in U.S. sales to the world’s top soybean buyer because of declining protein levels in U.S. soybeans, allowing Brazil to lure customers with its own higher-protein crop.
It also comes amid a growing trade spat between the United States and China, the world’s top two economies, after Washington slapped tariffs on imports of solar panels and washing machines earlier this year.
If sales to China keep falling it will be just reason why Soybean prices may be under pressure in the months ahead.
When/Nation
Monday, 2nd
0050 JPN Tankan Large Non-Manufacturers
Index Q1 Expected 24, Prior 23
0050 JPN Tankan Large Manufacturers Index
Q1 – Expected 25, Prior 25
0245 PRC CaixinManufacturing PMI Mar
Expected 51.7, Prior 51.6
1500 USA ISM Manufacturing PMI Mar
Expected 60.0, Prior 60.8
Tuesday 3rd
0855 GER Manufacturing PMI Mar
Expected 58.4, Prior 58.4
0930 UK Manufacturing PMI Mar
Expected 54.5, Prior 55.2
Wednesday 4th
0930 UK Construction PMI Mar
Expected 50.7, Prior 514
1000 EZ CPI YoY Mar (Preliminary)
Expected 1.4%, Prior 1.1%
1315 USA ADP Non-Farm
Employment Change Mar – Expected 205K, Prior 235K
1500 USA ISM Non-Manufacturing PMI Mar
Expected 59.0, Prior 59.5
15:30 USA Crude Oil Inventories
Expected -0.287M, Prior 1.643M
Thursday 5th
10:30 UK Services PMI Mar
Expected 54.0, Prior 54.5
Friday 6th
1330 USA Non-Farm Payroll Mar
Expected 198K, Prior 313K
1330 USA Unemployment Rate
Expected 4.0%, Prior 4.1%
Have a great week!