
Book a Free Consultation
A selloff in big U.S. tech shares did not pull money away from the sector, but U.S. large-cap stocks suffered outflows as investors grew more cautious about an aging bull market.
Overall investors shed risky assets this week, pulling $2 Billion from equity funds and plowing $2.2 Billion into bond fund.
A total of $0.9 Billion coursed into tech stocks, the 14th consecutive week of inflows, this despite hefty falls in Facebook and Twitter shares last week causing anxiety about the resilience of the FAANGs (Facebook, Amazon, Apple, Netflix, Google).
U.S. tech has driven the lion’s share of the equity market rally so far. Indeed, global equities have risen 2.8% YTD, however, without U.S. tech, they would be 0.8% lower.
The Corporate Earnings season will start to wind down a notch but remains plentiful.
Outflows of $1 Billion from U.S. large-cap stocks and $2.1 Billion from U.S. growth stocks this week testified to concerns these stocks could see their dominance challenged.
Investors started to turn instead to U.S. small-cap and value funds, though inflows were relatively small with $0.1 Billion each.
Healthcare, consumer and real estate sectors also enjoyed inflows this week, suggesting investors are turning towards defensive sectors in more volatile markets. Energy and financials funds saw outflows.
The trade war between the U.S. and China has had one major effect, losses in Chinese equities have taken their cumulative value down to $6.09 Trillion, according to data compiled by Bloomberg, below the $6.17 Trillion value of Japanese equities.
China’s stock market overtook Japan’s in 2014. The U.S. has the world’s most highly valued stock market, worth a little more than $31 Trillion.
The 10-year U.S. Treasury (T10) yield slipped about 2 basis points to 2.97% within a half hour after the U.S. Non-Farms Payrolls report showed weaker-than-expected jobs growth. Before the report, yield was at about 2.99%.
While the July figure of 157,000 new jobs fell short of consensus for 190,000; the June figure was revised up to an increase of 248,000 from 213,000 originally reported.
Unemployment, though, showed a strong economy, slipping to 3.9% from 4.0% last month.
The economy may be looking good for now, but one must wonder at the eye watering level of national debt the U.S. is creating. All that debt piling up in the government’s coffers is going to require the Treasury Department to get more creative in figuring out how to finance it.
In its quarterly refunding statement, the Treasury said it will be adding another $1 Billion a month to each of the auctions for two-, three- and five-year notes over the next three months. On top of that, it will increase the auction size for the seven- and 10-year notes and the 30-year bond by $1 Billion for the August sales.
The moves come as the government is looking for the best ways to handle a budget deficit expected to eclipse $1 Trillion in the next two years. The national debt is at $21.3 trillion, having risen about $800 billion in 2018.
So, on that note it is another bumper week for US govt bond supply sees $78 Billion in 3, 10 & 30-yr coupons and $151 Billion of T-bills, an interesting test for the BoJ’s YCC policy weak via way of 10 & 30-yr JGB sales, while the UK sells 10-year.
The Dollar fell against its rivals Friday as data showed the U.S. economy created fewer jobs than expected and services activity slowed in July. The U.S. Dollar Index fell by 0.15% to 94.86.
Analysts played down the weaker Non-Farm payrolls, saying the underlying trend of U.S. job creation remained on track.
USDJPY fell 0.38% to 111.23, while USDCHF fell 0.25% even as the Swiss National Bank said there was room to lower rates if needed.
EURUSD rose 0.05% to $1.1591 while USDCAD fell 0.35% to C$1.2978.
GBP/USD fell 0.01% to 1.3017 amid Brexit-related angst after the Bank of England Governor Mark Carney said the risk of a no-deal Brexit was “uncomfortably high.”
Metals:
What a torrid time for gold where negative sentiment is at historic highs. One starts to think that prices could continue to push lower and possibly below $1,200 an ounce in the near term as the market lacks a catalyst to reverse the current trend.
While gold is off its recent one-year low, the market is still preparing to end its fourth straight week in negative territory. Gold has closed lower seven out of the last eight weeks. December gold futures last traded at $1,224.40 an ounce, down 0.67% for the week.
Silver futures rose 0.52% to $15.47 a troy ounce, while platinum futures fell 0.86% to $835.30.
Copper prices rose 0.79% to $2.76, while zinc prices rose 1.62% at 2,606.50.
Aluminium prices fell 0.55% to 2,028.00, while Nickel futures rose 1.27% to 13,515.00.
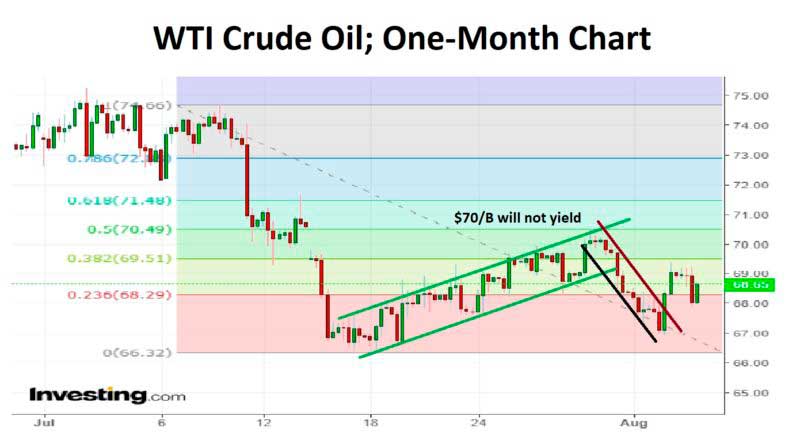
Oil:
The WTI Crude Oil market went back and forth during the week, trying to break above the $70 handle but failing. There was plenty of support near the $67 level, so it’s likely that we will continue to see volatility.
It’s going to be difficult to trade this market from the longer-term, as it increasingly looks to be stuck in a range between the $67 level and the bottom and the $70 level on the top. If we can break above $71, then the market probably goes to the $74 level above. If we break down below the uptrend line underneath, then the market should break down significantly.
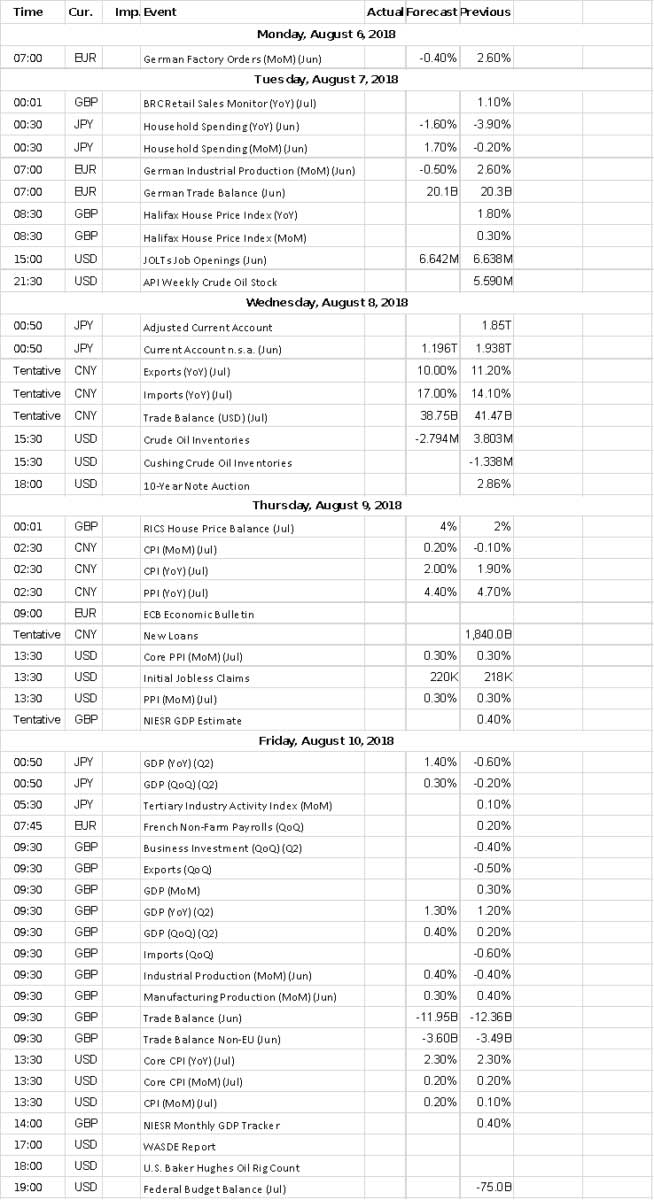
Economic Calendar:
The week ahead is busy with data points although after the U.S. Employment Report, all else feels like a step back for a few days.
Is there anything that will move the needles away from U.S./China trade tensions sadly, one has to say no.
The main pivot points in the coming week will be inflation data in China and the USA, Trade in China and Germany, Orders in Germany and Japan, Production data in UK and the Eurozone, and preliminary Q2 GDP for the UK.
It is a relatively light U.S. schedule although we cannot overlook PPI and CPI even if forecasts assume little sign of any material upward pressure on either.
CPI is projected to rise 0.2% on both headline and core, which would edge the headline YoY rate up to 3.0% from 2.9%, while leaving core at 2.3%. PPI is expected to move up 0.2% MoM headline and 0.3% MoM core; this would see YoY rates unchanged at 3.4% & 2.8% respectively.
JOLTS jobs opening, Consumer Credit and the Treasury Budget are also due.
China’s Trade data has been skewed somewhat by the front loading of imports and exports to try and beat trade tariffs. This must be seen as heightening the risk of some outlier readings relative to forecasts, with Trade Balance seen narrowing to a still very large $39.05 Billion. In this, exports are seen accelerating to a 17.0% YoY pace from June’s 14.1%, while imports are seen decelerating marginally to 10.0% from 11.2%.
It’s inflation data will need to be wide of the expected pick-up in CPI from 1.9% to 2.0% YoY, and a commodity and oil related dip in PPI to 4.5% vs. June’s 4.7%, the latter perhaps a little surprising given the Yuan’s fall versus the Dollar. Note, FX Reserves and FDI are also due.
Orders data in Germany and Japan have been rather mixed this year, with last month’s 2.6% jump in German Factory Orders halting a run of four consecutive declines, with June seen dipping 0.4%.
Japanese Machinery Orders have been all over the place with May’s 3.7% MoM drop following April’s 10.1% surge and -3.9% MoM in March, June is seen edging down 0.8%.
Q2 GDP (exp. 0.4% QoQ 1.3% YoY), Q2 Index of Services (0.6% YoY), Q2 Business Investment (0.2% QoQ) Industrial Production (0.7% MoM 0.3% YoY) and Construction Output (-0.3% MoM 0.7% YoY); ahead of that data dump there are BRC Retail Sales, Car Sales and the RICS House Price survey.
The run of central bank speakers is seasonally sparse, although in the Southern Hemisphere both the RBA and the RBNZ hold policy meetings while the USDA’s latest World Agricultural Supply and Demand Estimates will be closely watched in the dual contexts of U.S. /China trade tensions, and the impact of abnormally hot weather across much of the Northern Hemisphere.