
Bollinger Bands were created by American author and technical analyst, John Bollinger. They are a popular technical analysis tool used to identify market volatility, but they can also be used to generate potential buy and sell signals. They are made up of three lines:
- One simple moving average (SMA) usually 20 days/hours/etc. (Middle band)
- The SMA plus two standard deviations (Upper band)
- The SMA minus two standard deviations (Lower band)
The unique feature of Bollinger bands is that they can be interpreted in several different ways. They can be used to create trading strategies for sideways markets or trending markets, but you need to be clear and consistent in the way you use them.
Firstly, let’s look at the pros and cons of using Bollinger Bands.
Advantages:
- They give a quick illustration of price volatility to help traders assess current market conditions. They are dynamic since the bands expand when markets are volatile and contract when the price is moving sideways.
- They can be used to identify overbought and oversold market conditions. When the price approaches the upper band, the market may be considered overbought and when the price approaches the lower band, it indicates oversold levels.
- They can provide buy and sell signals in both trending and rangebound markets. Unlike many other indicators, Bollinger Band offer several different trading strategies, some applicable in range-bound markets and others in trending markets. (See the strategies below for more details).
- They can be combined with other indicators such as RSI, stochastics or even price patterns to reinforce other trade signals.
Disadvantages
Despite their many advantages, Bollinger Bands are by no means infallible.
- They can give false signals in trending markets. In strong uptrends/downtrends, the price can track along one of the bands, leading to premature trade exits or failed counter-trend trades. Also, in very volatile markets, a sudden price spike can break out quickly, causing misleading signals.
- They are seen as lagging indicators. Since they’re based on a moving average, some Bollinger Band strategies can give delayed trading signals.
- The range of Bollinger Band trading strategies is an advantage but also a drawback, since trading signals may be interpreted differently. For example, a touch of the lower band could indicate a breakout (sell signal) to some traders, but a reversal within a range (buy signal) to others.
Bollinger Band Trading Strategies
We’ve outlined three strategies below. Note that they are independent of each other and are each designed for different market conditions.
Range trading strategy
When the price is trading in a sideways range, it tends to oscillate up and down between the upper and lower bands. The assumption for this strategy to work is that the price will continue to trade sideways, continually reverting to mean at the moving average.
A buy signal is given when the price dips below the lower band and then closes back above it, while a sell signal is given when the price breaks above the upper band and then closes back below it. Profits can be taken either at the moving average or at the opposite band.
Pinch or Squeeze Strategy
The assumption here is that, before big moves, the price will experience a particularly low volatility period which will “pinch” or “squeeze” the bands tightly together.
When traders see this tightening, they can either set up a straddle trade (setting a buy order above the recent range and a sell order below) or wait for the breakout (above the top band or below the bottom band) and simply trade in that direction. They may also use other indicators to confirm the trade.
Trend Reversal Strategy
This strategy works best when used in conjunction with chart patterns such as double tops and bottoms or head & shoulders.
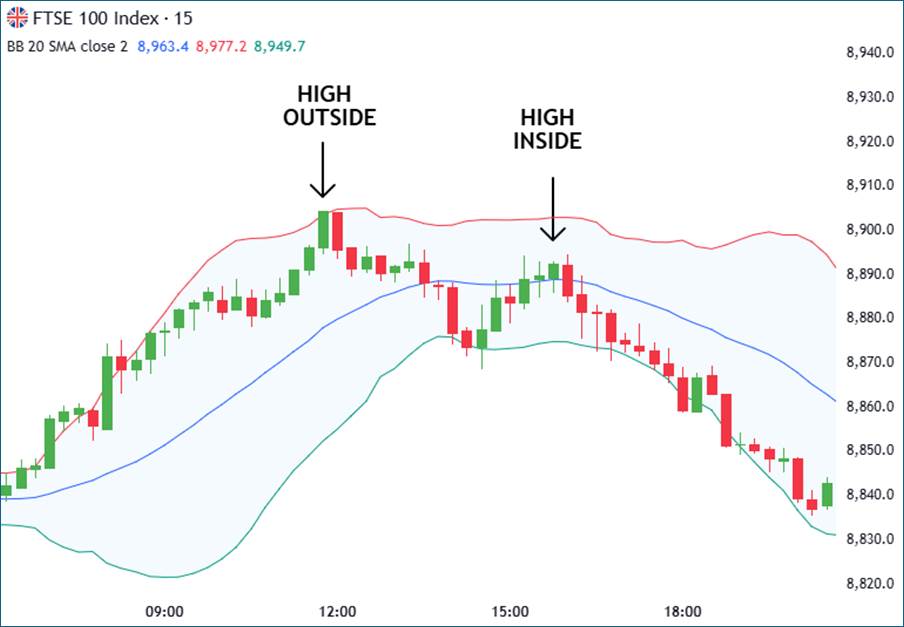
The key feature here is that (in an uptrend) the price makes a high outside the upper band, followed by a subsequent high inside the upper band. The Bollinger Band is illustrating the fading upward momentum, while the chart pattern provides further evidence that a trend may be about to reverse. Once the 2nd high is confirmed inside the upper band, a sell signal is generated for the potential trend reversal.
The exact same process can be applied in downtrends.
Conclusion
Bollinger Bands are extremely versatile indicators, generating several different types of trading signals in sideways and trending markets. It is always sensible to confirm Bollinger Band signals with other indicators, such as RIS or MACD, and avoid blindly jumping into trades just because the price hits one of the bands.
Bollinger Bands are certainly worth considering as part of your trading strategy, but make sure to fit the correct strategy to the current market conditions.