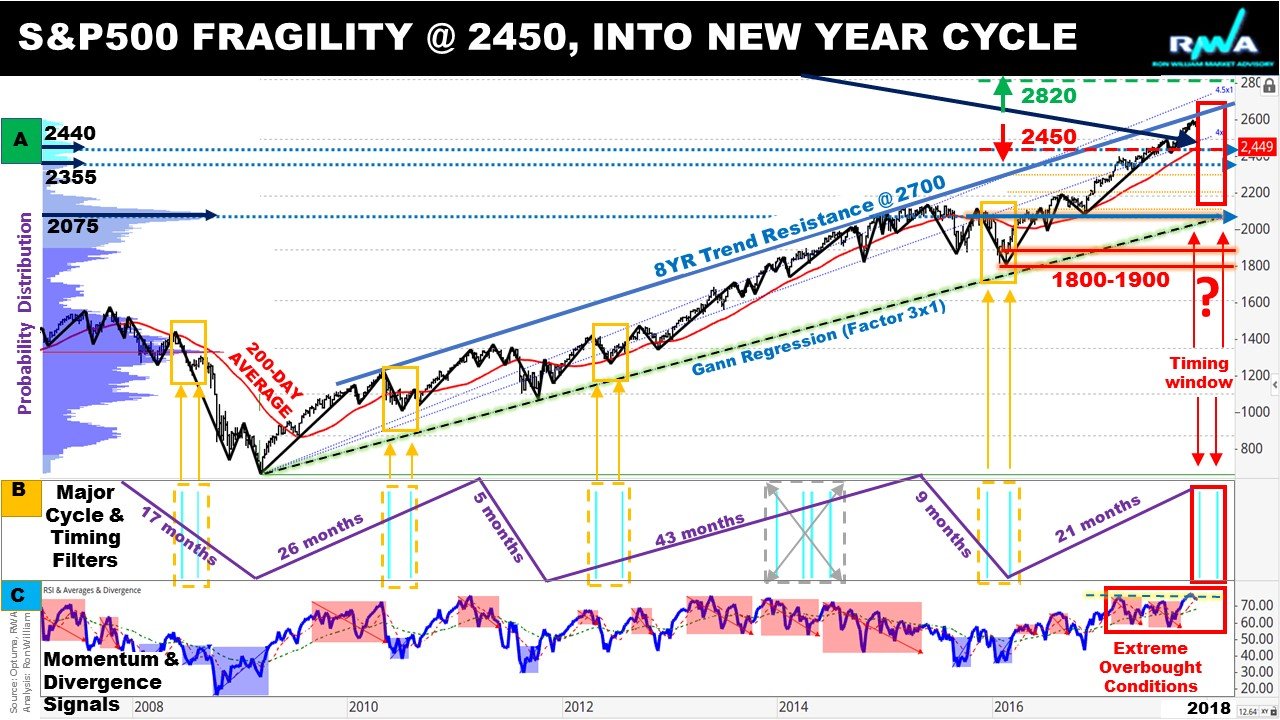
The S&P 500’s is warning of growing fragility as it hits an 8-year trend resistance, pressured by historically overbought conditions Fig 1.0.Downside risk levels can be found 2440-50, which is currently marked by the long-term 200-day or 40-week average and our probability distribution price analysis. Lower price targets can be found at 2100, which is uptrend support from the old 2009 lows, as highlighted by the slow rising regression-line (factor 3×1), based on the work of W D Gann. The prediction now is there should be a three-wave fall, into the new year, as marked by our cycle studies (lower panel B). This is contrary to traditional seasonality trends which historically outperform during the months of November to January, as part of a year-end “Santa-claus” rally, where institutional portfolio managers re-balance their books and investor psychology is more upbeat.
However, “this time may well be different” due to the fact that we have still not witnessed an equity market setback during the past autumn months, thereby intensifying the asymmetric nature of the cycle. Our expectations for a correction during the new year of 2018 will involve a fall, followed by a rally, then the rest of the fall. The absolute minimum drop should eliminate all the rise of this past year of 2017, and go back to the low just before Mr Trump was made President of the USA. Targets near 1800 are reasonable. It is entirely possible for a larger downtrend to develop from this point onwards.
Size matters
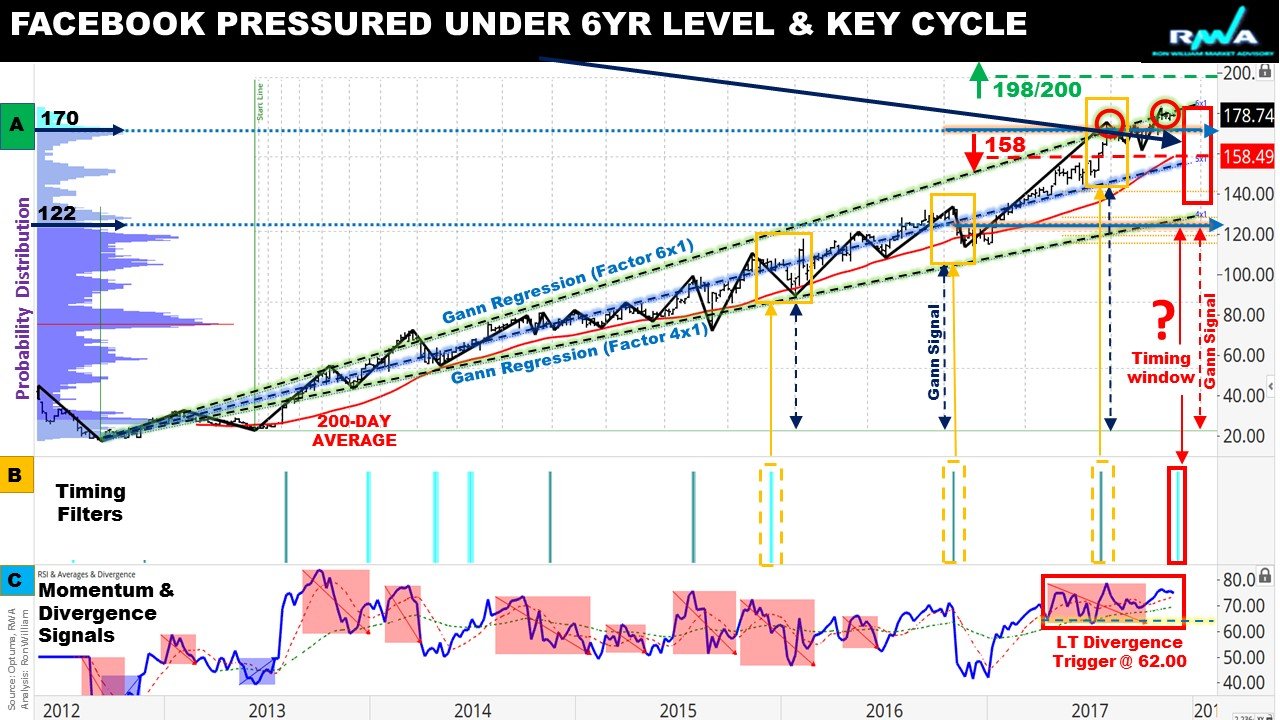
The S&P500 is an index which rocketed by 300%, fuelled like many others, by the weighting of highly valued market cap stocks. When we look at the stocks that have driven most of the rise, we find that it is only a few huge markets cap stocks that have done the business. These are covered by the acronym FANG (Facebook, Apple, Netflix & Google or Alphabet). Fig 2.0 (page 2) shows Facebook, which triggered a total rise that has approximately doubled the overall index.
It is typical of the stocks that have been holding up the entire index. There are very few of them. This introduces a degree of fragility into the market. It is like skating on very thin ice. Technically speaking, Facebook is now pressured under a 6-year old Gann resistance, into a key cycle window. Momentum indicators also signal long-term divergences, that would deteriorate under the 62% threshold. Meanwhile, our bearish price risk level is at 158. A sustained break here would unlock sharp losses into a confluence support zone between 126-127 and 116-119.
If Facebook, or another of the FANG stocks were to have a setback, then the entire index would drop rapidly. Typically, these few stocks do not have earnings. They are not cheap in fundamental terms, but they do have a good story behind them. All the money that is passively invested in indexes has been effectively herded into these few holdings and it has paid off well so far. However, it has produced bubble-like conditions in these markets and this is vulnerable to a sudden correction, akin to what happened in 1987.
Old Economy fading
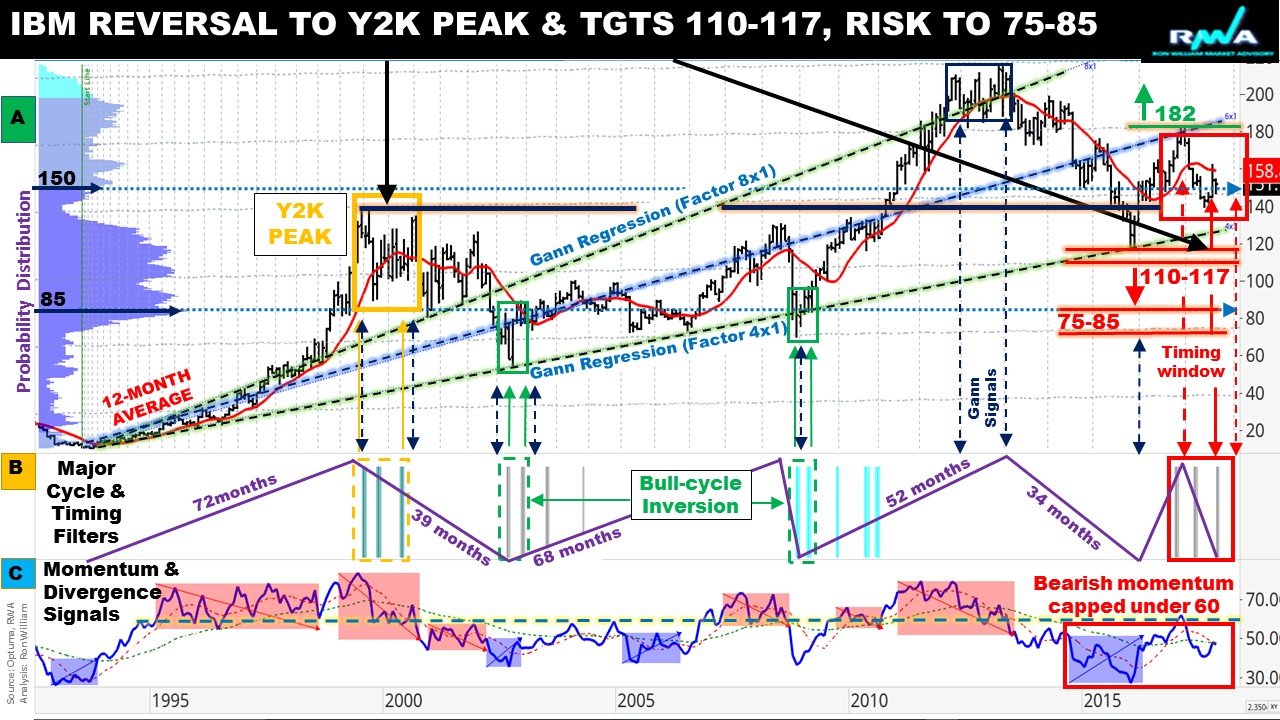
When we look at the companies that always used to be regarded as the backbone of corporate America, we find a very different story. Here, the share price peaked in 2012/2013, and has been in a bear market ever since. IBM, Wall-mart, General Electric, to name but a few, all tell the same story. Most of the old-economy, so-called “best stocks”, are in bear phase and not doing well. These days their market cap is not large enough to dominate the index as they used to do, but these are the stocks that have earnings and pay dividends. Even so, they are giving us a strong warning signal, with IBM already reversing back to its old Y2K peak, currently trading under its 12-month average, and the mid-Gann regression line (factor 6×1). Expect a targeting of the support zone 110-117, with risk to 75-85 (Fig 3.0). There also seems to be further cycle pressure ahead, weighed down by bearish momentum, which is capped under the key level at 60 (lower panel C).
The final warning comes from the bond market. In the past, whenever the rate of interest has bottomed and started to trend up, it has been only a matter of time till the equity market has a correction. All in all, we would rebalance the portfolio now and only hold those US equities that we are willing to live with for the long-term, regardless of price fluctuations.
Written by Ron William, LAT Senior Lecturer and Robin Griffiths, FSTA
Head Technical Strategist.
Are you interested in learning how to trade successfully? We have a variety of courses ranging from one week to three months for all levels, to find out more click here.